
Ascend Investing Column Archive
We believe informed investors make better investment decisions, and our “Ascend Investing” column aims to keep you up to date. You’ll find a collection of robust research that informs our approach and articles on prudent investment strategies and topics that can help you invest for the long term.

About the Author
Mark Bourguignon is the Founder and President of Ascend Wealth Management. Previously, Mark was a Director at Clearbridge Investments, a Legg Mason Company, where he was a Fund Manager for the Clearbridge Small Cap Value Fund and a Senior Portfolio Analyst for the firms all cap value, balanced income, and small cap strategies. Prior to Clearbridge, Mark served as the Director of Research for Option Advantage Partners L.P., which was the first private equity fund to provide institutional funding to entrepreneurs who wanted to tax-efficiently exercise their stock options. Mark led the fund's research effort on behalf of the General Partner and its accredited investors. Mark began his career as an equity research analyst at the investment banking firms Donaldson, Lufkin and Jenrette and Thomas Weisel Partners. Mark earned a Bachelor of Science degree in Finance from Marquette University.
About Ascend Wealth Management
Ascend Wealth Management is an independent private wealth management firm that works with individuals and families. The firm provides the highest standard of care and ethics in the investment industry—a fiduciary standard—which means their advice always serves a single purpose: to build financial security and wealth for you and your family.
The firm works closely with its clients in order to understand their unique needs, goals and risk tolerance and then builds customized investment portfolios of institutional-class funds designed specifically for long-term investors who are seeking an alternative to what is commonly available among the investment industry. Their strategy is based on sound, time-tested principles that have been confirmed by Nobel Prize-winning research and decades of empirical evidence.
We welcome the opportunity to meet with you, conduct a thorough review of your current investment strategy, answer all of your questions, and discuss how a sensible, evidence-based investment approach can provide you with greater prosperity and peace of mind that comes from knowing that your money is being managed with expert care.

What You Pay, What You Get: Connecting Price and Expected Returns
June 2018
It has been more than 50 years since the idea of stock prices containing all relevant information was put forth. Information might come in the form of data from a company’s financial statements, news about a new product, a change in the regulatory environment, or simply a shift of investors’ tastes and preferences toward owning different investments.
Information is incorporated into security prices through the buying and selling process. While fair prices may not depend on a certain level of trading, over $400 billion of stocks traded on average each day in the world equity markets suggests that a great deal of information is incorporated into stock prices. [1]
As investors, we should consider whether we want to use the price we observe or look for a better price. A recent study from Dimensional Fund Advisors shows that over the 15-year period ending December 2017, only 14% of investment managers that attempted to outguess the market survived and beat benchmarks.*
This study is just one of many conducted over the past 50 years that have documented similar results. With investing, many things are out of our control, but we can make decisions that improve our odds of having a positive investment experience. Looking at these results, attempting to identify a better price than the one we observe in the market may not be accomplishing this objective.
Exhibit 1. Mutual Fund Survivorship and Outperformance [2]
15-Year Period through December 31, 2017

*In the study results, “benchmark” refers to the Morningstar category index used to evaluate the performance of each respective mutual fund in the sample. The sample includes funds at the beginning of the 5-, 10-, and 15-year periods ending December 31, 2017. Past performance is no guarantee of future results. See footnote for additional information.
WHAT CAN WE LEARN FROM THE PRICE?
Beyond the challenge of trying to outguess the market, why is price so important? We should first understand the connection between the price you pay and the return you expect to receive.
Let’s consider an example: Imagine that you want to buy a house and you know for certain the house will be worth $2 million 10 years from now. If you pay $1 million for the house today or you pay $500,000, in which case would you earn a higher return? Obviously paying less, $500,000, would earn you a higher return.
Of course, investing offers few, if any, guarantees, and we can’t know for certain what something will be worth in the future. Given this, investors should think in terms of expected returns and what decisions will lead to an investment with higher expected returns. Holding other factors constant, the lower the price you pay, the higher the expected return, which is why it’s so important to consider a stock’s observed market price. The price paid has a direct connection to the return we expect to receive.
Exhibit 2. As Prices Change, So Do Expected Returns

For illustrative purposes only.
AS PRICES CHANGE, SO DO EXPECTED RETURNS
We also know that, in a changing world, new information becomes available on a regular basis and that new information can affect the price of stocks. Let’s imagine a pharmaceutical company announces a new drug that investors believe will generate substantial revenues for the company. If this news was previously unknown, once it becomes available, it will likely influence the price of the stock. The price will adjust based on new information, and as the price changes, so will the expected return. Changes in stock prices are taking place every day, and as prices change, so do expected returns.
INDEX MANAGEMENT AND MARKET PRICES [3]
Each year on the last Friday in June, the Russell indices go through a process called reconstitution . [4] In this process, certain stocks are added and deleted from the index. The goal of reconstitution is to periodically rebalance the index to account for historical changes in stocks during the prior period. Index providers, such as S&P, Russell, or CRSP, have different processes for adding and deleting stocks, and while each will have some variation, all will establish pre-set points in time to make their adjustments.
To decide which stocks will be added or deleted, the index provider may look at the market price of a stock to determine what is a small cap vs. large cap stock or what is a value vs. growth stock. It is only during these pre-set dates of reconstitution that index providers might consider market prices. On all other days between the reconstitution dates, changes in the prices of stocks are not being incorporated by the index. And since there is a direct relation between the price of a stock and expected return of a stock, indices are considering differences in expected returns only at infrequent intervals during the year. It not only seems logical that we may want to consider changes in market prices more frequently, the failure to do so can have a direct impact on the expected return of the index.
Again, this is why we believe using market prices is so important. The price we see gives us information about what we expect to receive. If you want to have an investment approach that targets higher expected returns every day, you need to ensure the approach incorporates changes in price every day. Otherwise, investors may not be getting what they think they are paying for.
Footnotes
[1] Daily average world equity trading in 2017 was $407.8 billion (in US dollars). Source: Dimensional, using data from Bloomberg LP. Includes primary and secondary exchange trading volume globally for equities. ETFs and funds are excluded. Daily averages were computed by calculating the trading volume of each stock daily as the closing price multiplied by shares traded that day. All such trading volume is summed up and divided by 252 as an approximate number of annual trading days.
[2] US-domiciled open-end mutual fund data is from Morningstar and Center for Research in Security Prices (CRSP) from the University of Chicago.
Equity fund sample includes the Morningstar historical categories: Diversified Emerging Markets, Europe Stock, Foreign Large Blend, Foreign Large Growth, Foreign Large Value, Foreign Small/Mid Blend, Foreign Small/Mid Growth, Foreign Small/Mid Value, Japan Stock, Large Blend, Large Growth, Large Value, Mid-Cap Blend, Mid-Cap Growth, Mid-Cap Value, Miscellaneous Region, Pacific/Asia ex-Japan Stock, Small Blend, Small Growth, Small Value, and World Stock. For additional information regarding the Morningstar historical categories, please see “The Morningstar Category Classifications” atmorningstardirect.morningstar.com/clientcomm/Morningstar_Categories_US_April_2016.pdf .
Index funds and fund-of-funds are excluded from the sample. Net assets for funds with multiple share classes or feeder funds are a sum of the individual share class total net assets. The return, expense ratio, and turnover for funds with multiple share classes are taken as the asset-weighted average of the individual share class observations. Fund share classes are aggregated at the strategy level using Morningstar FundID and CRSP portfolio number.
Each fund is evaluated relative to the Morningstar category index assigned to the fund’s category at the start of the evaluation period. So, if, for example, a fund changes from Large Value to Large Growth during the evaluation period, then its return will still be compared to the Large Value category index. Surviving funds are those with return observations for every month of the sample period. Winner funds are those that survived and whose cumulative net return over the period exceeded that of their respective Morningstar category index. Loser funds are funds that did not survive the period or whose cumulative net return did not exceed their respective Morningstar category index.
Indices are not available for direct investment. Their performance does not reflect the expenses associated with management of an actual portfolio. Index data provided by Bloomberg Barclays, MSCI, Russell, and S&P Dow Jones Indices. Bloomberg Barclays data provided by Bloomberg. MSCI data © MSCI 2018, all rights reserved. Frank Russell Company is the source and owner of the trademarks, service marks, and copyrights related to the Russell Indexes. S&P and Dow Jones data © 2018 S&P Dow Jones Indices LLC, a division of S&P Global.
[3] Indices cannot be invested into directly.
[4] In order to ensure proper liquidity in the markets, when the last Friday in June falls on the 29th or 30th, Russell reconstitution occurs on the preceding Friday. A full calendar for reconstitution is made available each spring.

Recent Market Volatility
February 2018
After a period of relative calm in the markets, in recent days the increase in volatility in the stock market has resulted in renewed anxiety for many investors .
From February 1–5, the US market (as measured by the Russell 3000 Index) fell almost 6%, resulting in many investors wondering what the future holds and if they should make changes to their portfolios. [1] While it may be difficult to remain calm during a substantial market decline, it is important to remember that volatility is a normal part of investing. Additionally, for long-term investors, reacting emotionally to volatile markets may be more detrimental to portfolio performance than the drawdown itself.
INTRA-YEAR DECLINES
Exhibit 1 shows calendar year returns for the US stock market since 1979, as well as the largest intra-year declines that occurred during a given year. During this period, the average intra-year decline was about 14%. About half of the years observed had declines of more than 10%, and around a third had declines of more than 15%. Despite substantial intra-year drops, calendar year returns were positive in 32 years out of the 37 examined. This goes to show just how common market declines are and how difficult it is to say whether a large intra-year decline will result in negative returns over the entire year.
Exhibit 1. US Market Intra-Year Gains and Declines vs. Calendar Year Returns, 1979–2017

In US dollars. US Market is measured by the Russell 3000 Index. Largest Intra-Year Gain refers to the largest market increase from trough to peak during the year. Largest Intra-Year Decline refers to the largest market decrease from peak to trough during the year. Frank Russell Company is the source and owner of the trademarks, service marks, and copyrights related to the Russell Indexes.
REACTING IMPACTS PERFORMANCE
If one was to try and time the market in order to avoid the potential losses associated with periods of increased volatility, would this help or hinder long-term performance? If current market prices aggregate the information and expectations of market participants, stock mispricing cannot be systematically exploited through market timing. In other words, it is unlikely that investors can successfully time the market, and if they do manage it, it may be a result of luck rather than skill. Further complicating the prospect of market timing being additive to portfolio performance is the fact that a substantial proportion of the total return of stocks over long periods comes from just a handful of days. Since investors are unlikely to be able to identify in advance which days will have strong returns and which will not, the prudent course is likely to remain invested during periods of volatility rather than jump in and out of stocks. Otherwise, an investor runs the risk of being on the sidelines on days when returns happen to be strongly positive.
Exhibit 2 helps illustrate this point. It shows the annualized compound return of the S&P 500 Index going back to 1990 and illustrates the impact of missing out on just a few days of strong returns. The bars represent the hypothetical growth of $1,000 over the period and show what happened if you missed the best single day during the period and what happened if you missed a handful of the best single days. The data shows that being on the sidelines for only a few of the best single days in the market would have resulted in substantially lower returns than the total period had to offer.
Exhibit 2. US Market Intra-Year Gains and Declines vs. Calendar Year Returns, 1979–2017

In US dollars. For illustrative purposes. The missed best day(s) examples assume that the hypothetical portfolio fully divested its holdings at the end of the day before the missed best day(s), held cash for the missed best day(s), and reinvested the entire portfolio in the S&P 500 at the end of the missed best day(s). Annualized returns for the missed best day(s) were calculated by substituting actual returns for the missed best day(s) with zero. S&P data © 2018 S&P Dow Jones Indices LLC, a division of S&P Global. All rights reserved. One-Month US T- Bills is the IA SBBI US 30 Day TBill TR USD, provided by Ibbotson Associates via Morningstar Direct. Data is calculated off rounded daily index values.
CONCLUSION
While market volatility can be nerve-racking for investors, reacting emotionally and changing long-term investment strategies in response to short-term declines could prove more harmful than helpful. By adhering to a well-thought-out investment plan, ideally agreed upon in advance of periods of volatility, investors may be better able to remain calm during periods of short-term uncertainty.
[ 1]. Frank Russell Company is the source and owner of the trademarks, service marks, and copyrights related to the Russell Indexes.

Nine Experts, Four Surprises, and One Million Dollar Bet
January 2018
In 2017, we were again reminded of the importance of following an investment approach based on discipline and diversification vs. prediction and timing. As we gear up for the new year, we can look at several examples during 2017 that provide perspective on what guidance investors may want to follow, or not follow, in order to achieve the long-term return the capital markets offer.
NINE EXPERTS
Each January, a well-known financial publication invites a group of experienced investment professionals to New York for a lengthy roundtable discussion of the investment outlook for the year ahead. The nine panelists have spent their careers studying companies and poring over economic statistics to find the most rewarding investment opportunities around the globe.
Ahead of 2017, the authors of the publication’s report were struck by the “remarkably cohesive consensus” among the members of the group, who often find much to disagree about. Not one pro expressed strong enthusiasm for US stocks in the year ahead, two expected returns to be negative for the year, and the most optimistic forecast was for a total return of 7%. They also found little to like in global markets, citing “gigantic geopolitical issues,” including a Chinese “debt bubble” and a “crisis” in the Italian banking system.
The excerpts below summarizing the panel’s outlook presented a less than optimistic view of the year ahead in January 2017.
“This could be the year when the movie runs backwards: Inflation awakens. Bond yields reboot. Stocks stumble. Active management rules. And we haven’t even touched on the coming regime change in Washington.”[1]
The outcome of these predictions: Zero-for-four, although some might point out that at least they got the direction right regarding the inflation rate.
In Inflation barely budged, moving to 2.17% for the January–November 2017 period, up from 2.07% for the year in 2016.[2]
The yield on the 10-year US Treasury note did not move up but instead slipped from 2.45% to 2.40%.
Stocks moved broadly higher around the world, in some cases dramatically. Twenty out of 47 countries tracked by MSCI achieved total returns in excess of 30%.[3]
According to Morningstar, the average large blend mutual fund underperformed the S&P 500 Index by 1.39 percentage points, and the average small company fund underperformed the S&P 600 Index by 1.35 percentage points.
The above-mentioned panel was no aberration. Among 15 prominent investment strategists polled by USA TODAY, the average prediction for US stocks for 2017 was 4.4%, while the most optimistic was 10.4%.[4] Expert or not, there is little evidence that accurate predictions about future events, as well as how the market will react to those events, can be achieved on a consistent basis.
FOUR SURPRISES
What do you get when you combine a tumultuous year for a new US president and divisive political trends in many global markets? Answer: a new record. For the first time since 1897, the total return for the US stock market (the CRSP 1-10 Index and, prior to 1926, the Dow Jones Industrial Average) was positive in every single month of the year. During the year, a great deal of media coverage was focused on markets at all-time highs, and some investors braced themselves for a sharp drop in stock prices. Not only did the much anticipated “correction” never occur, financial markets remained remarkably calm. Out of 254 trading days in 2017, the total return of the S&P 500 Index rose or fell over 1% only eight times. By comparison, in a more rambunctious year such as 1999, it did so 92 times.[5]
North Korea issued threats of a nuclear missile strike throughout the year and boasted that even mainland US cities were vulnerable to its newest warheads. Next-door neighbor South Korea would seem to have the most to lose if such a catastrophe occurred, but Korean stocks were among the top performers in 2017, with a total return of 29.5% in local currency and 46.0% in US dollar terms.[6]
To many experienced researchers, Chinese stocks appeared alarmingly vulnerable. A gloomy November 2016 article[7] warned that “China’s debt addiction could lead to a financial crisis.” In the article, a prominent Wall Street strategist observed: "It’s scary that China seems to be continuing its debt binge to achieve its unrealistic growth targets.” And a global fund manager noted: “We are the most underweight China we have been since launching the fund five years ago.” The outcome: China was the third best-performing stock market in 2017 with a total return of 51.6% in local currency and 50.7% in US dollar terms.[8]
The seven-year string of increasing US auto sales finally ended in 2017. Domestic sales fell 1.0% at Ford Motor, 1.3% at General Motors, and 10.7% at Fiat Chrysler.[9] Anticipating the sales slump, a Wall Street Journal columnist warned investors in January 2017 to avoid the stocks.[10] Good advice? Ford Motor had a total return of 8.7%, which was in fact below the 21.8% return of the S&P 500 Index. However, General Motors returned 22.5%, and Fiat Chrysler’s total return came in at an impressive 96.3%, even with more than a 10% drop in sales.[11]
While some of these examples may seem counterintuitive, the above “surprises” from 2017 reinforce the challenge of drawing a direct link between positive or negative events in the world and positive or negative returns in the stock market.
THE MILLION DOLLAR BET
Last year saw the conclusion of a 10-year wager between Warren Buffett, chairman of Berkshire Hathaway Inc., and Ted Seides, a New York hedge fund consultant. Seides responded to a public challenge issued by Buffett in 2007 regarding the merits of hedge funds relative to low-cost passive vehicles. The two men agreed to bet $1 million on the outcome of their respective investment strategies over the 10-year period from January 1, 2008, through December 31, 2017. Buffett selected the S&P 500 Index, Seides selected five hedge funds, and the stakes were earmarked for the winner’s preferred charity. The terms were revised midway through the period by converting the sum invested in bonds to Berkshire Hathaway shares, so the final amount is reported to be in excess of $2.2 million.
The 10-year period included years of dramatic decline for the S&P 500 Index (–37.0% in 2008) as well as above-average gains (+32.4% in 2013), so there was ample opportunity for clever managers to attempt to outperform a buy-and-hold strategy through a successful timing strategy. For fans of hedge funds, however, the results were not encouraging. For the nine-year period from January 1, 2008, through December 31, 2016, the average of the five funds achieved a total return of 22.0% compared to 85.5% for the S&P 500 Index.[12] (Results for 2017 have not yet been reported.)
Having fallen far behind after nine years, Seides graciously conceded defeat in mid-2017. But he pointed out in a May 2017 Bloomberg article that in the first 14 months of the bet, the S&P 500 Index declined roughly 50% while his basket of hedge funds declined less than half as much. He suggested that many investors bailed out of their S&P 500-type strategies in 2008 and never participated in the recovery. Hedge fund participants, he argued, "stood a much better chance of staying the course.”
Seides makes a valid point—long run returns don’t matter if the strategy is abandoned along the way. And there is ample evidence that some mutual fund investors sold in late 2008 and missed out on substantial subsequent gains. But do hedge funds offer the best solution to this problem? We think educating investors about the unpredictability of capital market returns and the importance of appropriate asset allocation will likely prove more fruitful than paying fees to guess where markets are headed next. A hypothetical global diversified allocation of 60% equities and 40% fixed income[13] still outperformed the hedge fund basket over the same nine years (56.6% vs. 22.0% in total returns).
Over any time period some managers will outperform index-type strategies, although most research studies find that the number is no greater than we would expect by chance. Advocates of active management often claim that this evidence does not concern them, since superior managers can be identified in advance by conducting a thorough assessment of manager skills. But this 10-year challenge offers additional evidence that investors will most likely find such efforts fail to improve their investment experience.
EXPECT THE UNEXPECTED
Financial markets surprised many investors in 2017, but then again they have a long history of surprising investors. For example, from 1926–2017, the annualized return for the S&P 500 Index was 10.2%. But returns in any single year were seldom close to this figure. They fell in a range between 8% and 12% only six times in the last 92 years but experienced gains or losses greater than 20% 40 times (34 gains, six losses). Investors should appreciate that many times realized returns may be far different from expected returns.
For a number of investors, 2017 was a paradox. The harder they tried to enhance their results by paying close attention to current events, the more likely they failed to capture the rate of return the capital markets offered.
New Year’s resolution: Keep informed on current events as a responsible citizen. Let the capital markets decide where returns will be generated.
APPENDIX
Dimensional 60/40 Balanced Strategy Index Rebalanced monthly. For illustrative purposes only. The balanced strategy index is not a recommendation for an actual allocation. All performance results are based on performance of indices with model/backtested asset allocations; the performance was achieved with the benefit of hindsight; it does not represent actual investment strategies, nor does it reflect fees associated with investing. Actual results may vary significantly.
The underlying Dimensional indices of the balanced strategy index have been retrospectively calculated by Dimensional Fund Advisors LP and did not exist prior to their inceptions dates. Other periods selected may have different results, including losses. Backtested index performance is hypothetical, is not actual performance and is provided for informational purposes only. Backtested performance results assume the reinvestment of dividends and capital gains. Additional information is available upon request.
1. Lauren R. Rublin, “Stocks Could Post Limited Gains in 2017 as Yields Rise,” Barron’s, January 14, 2017.
2. Inflation data © 2018 and earlier, Morningstar. All rights reserved. Underlying data provided by Ibbotson Associates via Morningstar Direct.
3. As measured by the MSCI All Country World IMI Index (net dividends).
4. Adam Shell, “How Will Stocks Make Out in 2017?” USA TODAY, December 24, 2016.
5. S&P data © 2018 S&P Dow Jones Indices LLC, a division of S&P Global. All rights reserved.
6. As measured by the MSCI Korea IMI Index (net dividends). MSCI data © MSCI 2018, all rights reserved.
7. Jonathan R. Laing, “China’s Debt Addiction Could Lead to Financial Crisis,” Barron’s, November 5, 2016.
8. As measured by the MSCI China IMI Index (net dividends). MSCI data © MSCI 2018, all rights reserved.
9. Neal E. Boudette, “Car Sales End a 7 Year Upswing, With More Challenges Ahead,” New York Times, January 3, 2018.
10. Steven Russolillo, “Yellow Flag Waves Over Auto Stocks,” Wall Street Journal, January 4, 2017.
11. Ford Motor, General Motors, and Fiat Chrysler returns provided by Bloomberg Finance LP.
12. Hedge fund data from Chairman’s Letter, Berkshire Hathaway Inc. 2016 annual report.
13. Global diversified allocation is the Dimensional 60/40 Balanced Strategy Index. Indices cannot be invested into directly. See Appendix for index description. Past performance is no guarantee of future investment results

Key Questions for the Long-Term Investor
November 2017
Focusing on what you can control can lead to a better investment experience.
Whether you’ve been investing for decades or are just getting started, at some point on your investment journey you’ll likely ask yourself some of the questions below. Trying to answer these questions may be intimidating, but know that you’re not alone. While this is not intended to be an exhaustive list it will hopefully shed light on a few key principles, using data and reasoning, that may help improve investors’ odds of investment success in the long run.
1. What sort of competition do I face as an investor?
The market is an effective information-processing machine. Millions of market participants buy and sell securities every day and the real-time information they bring helps set prices.
This means competition is stiff and trying to outguess market prices is difficult for anyone, even professional money managers (see question 2 for more on this ). This is good news for investors though. Rather than basing an investment strategy on trying to find securities that are priced “incorrectly,” investors can instead rely on the information in market prices to help build their portfolios (see question 5 for more on this ).

Source: World Federation of Exchanges members, affiliates, correspondents, and non-members. Trade data from the global electronic order book. Daily averages were computed using year-to-date totals as of December 31, 2016, divided by 250 as an approximate number of annual trading days.
2. What are my chances of picking an investment fund that survives and outperforms?
Flip a coin and your odds of getting heads or tails are 50/50. Historically, the odds of selecting an investment fund that was still around 15 years later are about the same. Regarding outperformance , the odds are even worse. The market’s pricing power works against fund managers who try to outperform through stock picking or market timing. One needn’t look further than real-world results to see this. A 2017 study of the mutual fund landscape showed that only 17% of US equity mutual funds and 18% of fixed income funds have survived and outperformed their benchmarks over the past 15 years. In other words, the deck is stacked against mutual funds that attempt to outguess the market.

Source: *Mutual Fund Landscape 2017, Dimensional Fund Advisors. See Appendix for important details on the study. Past performance is no guarantee of future results.
3. If I choose a fund because of strong past performance, does that mean it will do well in the future?
Some investors select mutual funds based on past returns. However, research shows that most funds in the top quartile (25%) of previous five-year returns did not maintain a top-quartile ranking in the following year. In other words, past performance offers little insight into a fund’s future returns.
This lack of persistence casts further doubt on the ability of managers to consistently gain an informational advantage on the market. Some fund managers might be better than others, but track records alone may not provide enough insight to identify management skill. Stock and bond returns contain a lot of noise, and impressive track records may result from good luck. The assumption that strong past performance will continue often proves faulty, leaving many investors disappointed.

Source: *Mutual Fund Landscape 2017, Dimensional Fund Advisors. See Appendix for important details on the study. Past performance is no guarantee of future results.
4. Do I have to outsmart the market to be a successful investor?
Financial markets have rewarded long-term investors. People expect a positive return on the capital they invest, and historically, the equity and bond markets have provided growth of wealth that has more than offset inflation. Instead of fighting markets, let them work for you.

US Small Cap is the CRSP 6–10 Index. US Large Cap is the S&P 500 Index. Long-Term Government Bonds is the IA SBBI US LT Govt TR USD, provided by Ibbotson Associates via Morningstar Direct. Treasury Bills is the IA SBBI US 30 Day TBill TR USD, provided by Ibbotson Associates via Morningstar Direct. US Inflation is measured as changes in the US Consumer Price Index. US Consumer Price Index data is provided by the US Department of Labor Bureau of Labor Statistics. CRSP data is provided by the Center for Research in Security Prices, University of Chicago. The S&P data is provided by Standard & Poor’s Index Services Group. Indices are not available for direct investment. Index performance does not reflect the expenses associated with the management of an actual portfolio. Past performance is no guarantee of future results.
5. Is there a better way to build a portfolio?
Academic research has identified certain equity and fixed income factors, which point to differences in expected returns among securities. Instead of attempting to outguess market prices, investors can instead pursue higher expected returns by structuring their portfolio around these factors.
In the equity market, the factors are size (small cap vs. large cap), relative price (value vs. growth), and expected profitability (high vs. low). In the fixed income market, these factors are term and credit quality. The return differences between stocks and bonds can be considerably large, as can the return differences among a group of stocks or bonds.
To be considered a reliable factor, it must be sensible, backed by data over time and across markets, and cost-effective to capture in diversified portfolios.
In a factors-based approach, capturing returns does not involve predicting which stocks, bonds, or market areas are going to outperform in the future. Rather, the goal is to hold well-diversified portfolios that emphasize factors that produce higher expected returns, control costs, and have low turnover.

Relative price is measured by the price-to-book ratio; value stocks are those with lower price-to-book ratios. Profitability is a measure of current profitability based on information from individual companies’ income statements.
6. Is international investing for me?
Diversification helps reduce risks that have no expected return, but diversifying only within your home market may not be enough. Instead, global diversification can broaden your investment opportunity set. By holding a globally diversified portfolio, investors are well positioned to capture returns wherever they occur.

Number of holdings and countries for the S&P 500 Index and MSCI ACWI (All Country World Index) Investable Market Index (IMI) as of December 31, 2016. The S&P data is provided by Standard & Poor’s Index Services Group. MSCI data ©MSCI 2017, all rights reserved. International investing involves special risks such as currency fluctuation and political stability. Investing in emerging markets may accentuate those risks. Diversification does not eliminate the risk of market loss. Indices are not available for direct investment.
7. Will making frequent changes to my portfolio help me achieve investment success?
Even with a globally diversified portfolio, market movements can tempt investors to switch asset classes based on predictions of future performance.
The image below features annual ranked performance of major asset classes in the US and international markets over the past 15 years. The asset classes are represented by corresponding market indices and the patchwork dispersion of colors shows that the relative performance of asset classes is unpredictable across periods.
Investors who follow a structured, diversified approach are well positioned to capture returns whenever and wherever they occur. Diversification also reduces the risk of being heavily invested in an underperforming asset group in any given year.

US Large Cap is the S&P 500 Index. US Large Cap Value is the Russell 1000 Value Index. US Small Cap is the Russell 2000 Index. US Small Cap Value is the Russell 2000 Value Index. US Real Estate is the Dow Jones US Select REIT Index. International Large Cap Value is the MSCI World ex USA Value Index (net dividends). International Small Cap Value is the MSCI World ex USA Small Cap Value Index (net dividends). Emerging Markets is the MSCI Emerging Markets Index (net dividends). Five-Year US Government Fixed is the Bloomberg Barclays US TIPS Index 1–5 Years. The S&P data is provided by Standard & Poor’s Index Services Group. Frank Russell Company is the source and owner of the trademarks, service marks, and copyrights related to the Russell Indexes. Dow Jones data provided by Dow Jones Indices. MSCI data ©MSCI 2017, all rights reserved. Bloomberg Barclays data provided by Bloomberg. Indices are not available for direct investment. Index performance does not reflect the expenses associated with the management of an actual portfolio. Past performance is no guarantee of future results.
8. Should I make changes to my portfolio based on what I’m hearing in the news?
Daily market news and commentary can challenge your investment discipline. Some messages stir anxiety about the future, while others tempt you to chase the latest investment fad. If headlines are unsettling, consider the source and try to maintain a long-term perspective.

9. So, what should I be doing?
At Ascend Wealth Management, we believe that focusing on what you can control can lead to a better investment experience.
Create an investment plan to fit your needs and risk tolerance.
Structure a portfolio along the dimensions of expected returns.
Diversify globally.
Manage expenses, turnover, and taxes.
Stay disciplined through market dips and swings.
APPENDIX
Question 2: The sample includes US-based funds at the beginning of the 15-year period ending December 31, 2016. Each fund is evaluated relative to the Morningstar benchmark assigned to the fund’s category at the start of the evaluation period. Surviving funds are those with return observations for every month of the sample period. Winner funds are those that survived and whose cumulative net return over the period exceeded that of their respective Morningstar category benchmark.
Question 3: At the end of each year, funds are sorted within their category based on their five-year total return. Funds in the top quartile (25%) of returns are evaluated again in the following year based on one-year performance in order to determine the percentage of funds that maintained a top-quartile ranking. The analysis is repeated each year from 2007–2016. The chart shows average persistence of top-quartile funds during the 10-year period.
Questions 2 and 3: US-domiciled open-end mutual fund data is from Morningstar and Center for Research in Security Prices (CRSP) from the University of Chicago. Index funds and fund-of-funds are excluded from the sample. Equity fund sample includes the Morningstar historical categories: Diversified Emerging Markets, Europe Stock, Foreign Large Blend, Foreign Large Growth, Foreign Large Value, Foreign Small/Mid Blend, Foreign Small/Mid Growth, Foreign Small/Mid Value, Japan Stock, Large Blend, Large Growth, Large Value, Mid- Cap Blend, Mid-Cap Value, Miscellaneous Region, Pacific ex-Japan Stock, Small Blend, Small Growth, Small Value, and World Stock. Fixed income fund sample includes the Morningstar historical categories: Corporate Bond, Inflation-Protected Bond, Intermediate Government, Intermediate-Term Bond, Muni California Intermediate, Muni National Intermediate, Muni National Short, Muni New York Intermediate, Muni Single State Short, Short Government, Short-Term Bond, Ultrashort Bond, and World Bond. For additional information regarding the Morningstar historical categories, please see “The Morningstar Category Classifications” at morningstardirect.morningstar.com/clientcomm/ Morningstar_Categories_US_April_2016.pdf . See Dimensional’s “Mutual Fund Landscape 2017” for more detail. Benchmark data provided by Bloomberg Barclays, MSCI, Russell, Citigroup, and S&P. Bloomberg Barclays data provided by Bloomberg. MSCI data © MSCI 2017, all rights reserved. Frank Russell Company is the source and owner of the trademarks, service marks, and copyrights related to the Russell Indexes. Citi fixed income indices © 2017 by Citigroup. The S&P data is provided by Standard & Poor’s Index Services Group.

Lessons for the Next Crisis
SEPTEMBER 2017
It will soon be the 10-year anniversary of when, in early October 2007, the S&P 500 Index hit what was its highest point before losing more than half its value over the next year and a half during the global financial crisis.
Over the coming weeks and months, as other anniversaries of major crisis-related events pass (for example, 10 years since the bank run on Northern Rock or 10 years since the collapse of Lehman Brothers), there will likely be a steady stream of retrospectives on what happened as well as opinions on how the environment today may be similar or different from the period leading up to the crisis. It is difficult to draw useful conclusions based on such observations; financial markets have a habit of behaving unpredictably in the short run. There are, however, important lessons that investors might be well-served to remember: Capital markets have rewarded investors over the long term, and having an investment approach you can stick with—especially during tough times—may better prepare you for the next crisis and its aftermath.
BENEFITS OF HINDSIGHT
In 2008, the stock market dropped in value by almost half. Being a decade removed from the crisis may make it easier to take the past in stride. The eventual rebound and subsequent years of double-digit gains have also likely helped in this regard. While the events of the crisis were unfolding, however, a future of this sort looked anything but certain. Headlines such as “Worst Crisis Since ’30s, With No End Yet in Sight,” [1] “Markets in Disarray as Lending Locks Up,” [2] and “For Stocks, Worst Single-Day Drop in Two Decades” [3] were common front page news. Reading the news, opening up quarterly statements, or going online to check an account balance were, for many, stomach-churning experiences.
While being an investor today (or during any period, for that matter), is by no means a worry-free experience, the feelings of panic and dread felt by many during the financial crisis were distinctly acute. Many investors reacted emotionally to these developments. In the heat of the moment, some decided it was more than they could stomach, so they sold out of stocks. On the other hand, many who were able to stay the course and stick to their approach recovered from the crisis and benefited from the subsequent rebound in markets.
It is important to remember that this crisis and the subsequent recovery in financial markets was not the first time in history that periods of substantial volatility have occurred.Exhibit 1 helps illustrate this point. The exhibit shows the performance of a balanced investment strategy following several crises, including the bankruptcy of Lehman Brothers in September of 2008, which took place in the middle of the financial crisis. Each event is labeled with the month and year that it occurred or peaked.
Exhibit 1. The Market's Response to Crisis
Performance of a Balanced Strategy (60% Stock / 40% Bond)

In US dollars. Represents cumulative total returns of a balanced strategy invested on the first day of the following calendar month of the event noted. Balanced Strategy: 12% S&P 500 Index,12% Dimensional US Large Cap Value Index, 6% Dow Jones US Select REIT Index, 6% Dimensional International Marketwide Value Index, 6% Dimensional US Small Cap Index, 6% Dimensional US Small Cap Value Index, 3% Dimensional International Small Cap Index, 3% Dimensional International Small Cap Value Index, 2.4% Dimensional Emerging Markets Small Index, 1.8% Dimensional Emerging Markets Value Index, 1.8% Dimensional Emerging Markets Index, 10% Bloomberg Barclays Treasury Bond Index 1-5 Years, 10% Citigroup World Government Bond Index 1-5 Years (hedged), 10% Citigroup World Government Bond Index 1-3 Years (hedged), 10% BofA Merrill Lynch 1-Year US Treasury Note Index. The S&P data are provided by Standard & Poor’s Index Services Group. The Merrill Lynch Indices are used with permission; copyright 2017 Merrill Lynch, Pierce, Fenner & Smith Incorporated; all rights reserved. Citigroup Indices used with permission, © 2017 by Citigroup. Bloomberg Barclays data provided by Bloomberg. For illustrative purposes only. Dimensional indices use CRSP and Compustat data. Indices are not available for direct investment. Their performance does not reflect the expenses associated with the management of an actual portfolio. Past performance is not a guarantee of future results. Not to be construed as investment advice. Rebalanced monthly. Returns of model portfolios are based on back-tested model allocation mixes designed with the benefit of hindsight and do not represent actual investment performance. See Appendix for additional information.
Although a globally diversified balanced investment strategy invested at the time of each event would have suffered losses immediately following most of these events, financial markets did recover, as can be seen by the three- and five-year cumulative returns shown in the exhibit. In advance of such periods of discomfort, having a long-term perspective, appropriate diversification, and an asset allocation that aligns with their risk tolerance and goals can help investors remain disciplined enough to ride out the storm. A financial advisor can play a critical role in helping to work through these issues and in counseling investors when things look their darkest.
CONCLUSION
In the mind of some investors, there is always a “crisis of the day” or potential major event looming that could mean the beginning of the next drop in markets. As we know, predicting future events correctly, or how the market will react to future events, is a difficult exercise. It is important to understand, however, that market volatility is a part of investing. To enjoy the benefit of higher potential returns, investors must be willing to accept increased uncertainty. A key part of a good long-term investment experience is being able to stay with your investment philosophy, even during tough times. A well‑thought‑out, transparent investment approach can help people be better prepared to face uncertainty and may improve their ability to stick with their plan and ultimately capture the long-term returns of capital markets.
Footnotes
[1] wsj.com/articles/SB122169431617549947.
[2] washingtonpost.com/wp-dyn/content/article/2008/09/17/AR2008091700707.html.
[3] nytimes.com/2008/09/30/business/30markets.html.
Appendix
Balanced Strategy 60/40
The model’s performance does not reflect advisory fees or other expenses associated with the management of an actual portfolio. The balanced strategies are not recommendations for an actual allocation.
International Value represented by Fama/French International Value Index for 1975–1993. Emerging Markets represented by MSCI Emerging Markets Index (gross dividends) for 1988–1993. Emerging Markets weighting allocated evenly between International Small Cap and International Value prior to January 1988 data inception. Emerging Markets Small Cap represented by Fama/French Emerging Markets Small Cap Index for 1989–1993. Emerging Markets Value and Small Cap weighting allocated evenly between International Small Cap and International Value prior to January 1989 data inception. Two-Year Global weighting allocated to One‑Year prior to January 1990 data inception. Five-Year Global weighting allocated to Five-Year Government prior to January 1990 data inception. For illustrative purposes only.
The Dimensional Indices used have been retrospectively calculated by Dimensional Fund Advisors LP and did not exist prior to their index inceptions dates. Accordingly, results shown during the periods prior to each Index’s index inception date do not represent actual returns of the Index. Other periods selected may have different results, including losses.

When Rates Go Up, Do Stocks Go Down?
JULY 2017
Should stock investors worry about changes in interest rates?
Research shows that, like stock prices, changes in interest rates and bond prices are largely unpredictable [1]. It follows that an investment strategy based upon attempting to exploit these sorts of changes isn’t likely to be a fruitful endeavor. Despite the unpredictable nature of interest rate changes, investors may still be curious about what might happen to stocks if interest rates go up.
Unlike bond prices, which tend to go down when yields go up, stock prices might rise or fall with changes in interest rates. For stocks, it can go either way because a stock’s price depends on both future cash flows to investors and the discount rate they apply to those expected cash flows. When interest rates rise, the discount rate may increase, which in turn could cause the price of the stock to fall. However, it is also possible that when interest rates change, expectations about future cash flows expected from holding a stock also change. So, if theory doesn’t tell us what the overall effect should be, the next question is what does the data say?
RECENT RESEARCH
Recent research performed by Dimensional Fund Advisors helps provide insight into this question [2]. The research examines the correlation between monthly US stock returns and changes in interest rates [3]. Exhibit 1 shows that while there is a lot of noise in stock returns and no clear pattern, not much of that variation appears to be related to changes in the effective federal funds rate [4].
Exhibit 1. Monthly US Stock Returns against Monthly Changes in Effective Federal Funds Rate,
August 1954–December 2016

For example, in months when the federal funds rate rose, stock returns were as low as –15.56% and as high as 14.27%. In months when rates fell, returns ranged from –22.41% to 16.52%. Given that there are many other interest rates besides just the federal funds rate, Dai also examined longer-term interest rates and found similar results.
So to address our initial question: when rates go up, do stock prices go down? The answer is yes, but only about 40% of the time. In the remaining 60% of months, stock returns were positive. This split between positive and negative returns was about the same when examining all months, not just those in which rates went up. In other words, there is not a clear link between stock returns and interest rate changes.
CONCLUSION
There’s no evidence that investors can reliably predict changes in interest rates. Even with perfect knowledge of what will happen with future interest rate changes, this information provides little guidance about subsequent stock returns. Instead, staying invested and avoiding the temptation to make changes based on short-term predictions may increase the likelihood of consistently capturing what the stock market has to offer.
Footnotes: [1] See, for example, Fama 1976, Fama 1984, Fama and Bliss 1987, Campbell and Shiller 1991, and Duffee 2002; [2] Wei Dai, “Interest Rates and Equity Returns” (Dimensional Fund Advisors, April 2017); [3] US stock market defined as Fama/French Total US Market Index; [4] The federal funds rate is the interest rate at which depository institutions lend funds maintained at the Federal Reserve to another depository institution overnight.
Glossary
Discount Rate: Also known as the “required rate of return,” this is the expected return investors demand for holding a stock.
Correlation: A statistical measure that indicates the extent to which two variables are related or move together. Correlation is positive when two variables tend to move in the same direction and negative when they tend to move in opposite directions.
Index Descriptions
Fama/French Total US Market Index: Provided by Fama/French from CRSP securities data. Includes all US operating companies trading on the NYSE, AMEX, or Nasdaq NMS. Excludes ADRs, investment companies, tracking stocks, non-US incorporated companies, closed-end funds, certificates, shares of beneficial interests, and Berkshire Hathaway Inc. (Permco 540)

Evolution of Financial Research: The Profitability Premium
APRIL 2017
Since the 1950s, there have been numerous breakthroughs in the field of financial economics that have benefited investors.
One early example, resulting from research in the 1950s, is the insight that diversification can increase an investor’s wealth. Another example, resulting from research in the 1960s, is that market prices contain up-to-the-minute, relevant information about an investment’s expected return and risk. This means that market prices provide our best estimate of asecurity’s value. Seeking to outguess market prices and identify over- and undervalued securities is not a reliable way to improve returns.
This long history of innovation in research continues into the present day. As academics and market participants seek to better understand security markets, insights from their research can enable investors to better pursue their investment goals. In this article, we will focus on a series of recent breakthroughs into the relation between a firm’s profitability and its stock returns. As we will see, an important insight Dimensional drew from this research is how profitability and market prices can be used to increase the expected returns of a stock portfolio without having to attempt to outguess market prices.
DIFFERENCES IN EXPECTED RETURNS
The price of a stock depends on a number of variables. For example, one variable is what a company owns minus what it owes (also called book value of equity). Expected profits, and the discount rate investors apply to these profits, are others. This discount rate is the expected return investors demand for holding the stock. The impact of market participants trading stocks is that market prices quickly find an equilibrium point where the expected return of a stock is commensurate with what investors demand.
Decades of theoretical and empirical research have shown that not all stocks have the same expected return. Stated simply, investors demand higher returns to hold some stocks and lower returns to hold others. Given this information, is there a systematic way to identify those differences?
OBSERVING THE UNOBSERVABLE: CURRENT AND FUTURE PROFITABILITY
Market prices and expected future profits contain information about expected returns. While we can readily observe market prices as stocks are traded (think about a ticker tape scrolling across a television screen), we cannot observe market expectations for future profits or future profitability, which is profits divided by book value. So how can we use an unobserved variable to tell us about expected returns?
A paper by Professors Eugene Fama and Kenneth French published in 2006 [1] tackles this problem. Fama and French have authored more than 160 papers. They both rank within the top 10 most-cited fellows of the American Finance Association [2] and in 2013, Fama received a Nobel Prize in Economics Science for his work on securities markets.
Fama and French explored which financial data that is observable today contain information about expected future profitability. They found that a firm’s current profitability contains information about its profitability many years hence. What insights did Dimensional glean from this? Current profitability contains information about aggregate investor’s expectations of future profitability.
MEASURING PROFITABILITY
The next academic breakthrough on profitability research was done by Professor Robert Novy-Marx, a world-renowned expert on empirical asset pricing. Building on the work of Fama and French, he explored the relation of different measures of current profitability to stock returns.
Profits equal revenues minus expenses. One particularly important insight Dimensional took from Novy-Marx’s work is that not all current revenues and expenses have information about future profits. For example, firms sometimes call a revenue or expense “extraordinary” when they do not expect it to recur in the future. If those revenues or expenses are not expected to recur, should investors expect them to contain information about future profitability? Probably not.
This is what Novy-Marx found when conducting his research. In a paper published in 2013 [3] , he used US data since the 1960s and a measure of current profitability that excluded some non-recurring costs so that it could be a better estimate for expected future profitability. In doing so, he was able to document a strong relation between current profitability and future stock returns. That is, firms with higher profitability tended to have higher returns than those with low profitability. This is referred to as a profitability premium.
Around the same time, the Research team at Dimensional was also conducting research into profitability. They extended the work of Fama and French and found that in developed and emerging markets globally, current profitability has information about future profitability and that firms with higher profitability have had higher returns than those with low profitability. They also found that this observation held true when using different ways of measuring current profitability. These robustness checks are important to show that the profitability premiums observed in the original studies were not just due to chance.
Their research indicated that when using current profitability to increase the expected returns of a real-world strategy, it is important to have a thoughtful measure of profitability that provides a complete picture of a firm’s expenses while excluding revenues and expenses that may be unusual and therefore not expected to persist in the future.
THE SIZE OF THE PROFITABILITY PREMIUM
So how large has the profitability premium been historically? Large enough that investors who want to increase expected returns in a systematic way should take note. Exhibit 1 shows empirical evidence of the profitability premium in the US and globally. In the US, between 1964 and 2016, the Dimensional US High Profitability Index and the Dimensional US Low Profitability Index had annualized compound returns of 12.55% and 8.23%, respectively. The difference between these figures, 4.32%, is a measure of the realized profitability premium in the US over the corresponding time period. The non-US developed market realized profitability premium was 4.51% between 1990 and 2016. In emerging markets, the realized profitability premium was 5.21% between 1996 and 2016.
[1]. Eugene Fama and Kenneth French, “Profitability, Investment, and Average Returns,” Journal of Financial Economics, vol. 82 (2006), 491–518.
[2]. G. William Schwert and Renè Stulz, “Gene Fama’s Impact: A Quantitative Analysis,” (working paper, Simon Business School, 2014, No. FR 14-17).
[3]. Robert Novy-Marx, “The Other Side of Value: The Gross Profitability Premium,” Journal of Financial Economics, vol. 108 (2013), 1–28.
Exhibit 1. The Profitability Premium

Profitability is measured as operating income before depreciation and amortization minus interest expense scaled by book. Indices are not available for direct investment. Their performance does not reflect the expenses associated with the management of an actual portfolio. Past performance is not a guarantee of future results. Index returns are not representative of actual portfolios and do not reflect costs and fees associated with an actual investment. Actual returns may be lower. See “Index Descriptions” in the appendix for descriptions of Dimensional and Fama/French index data. Eugene Fama and Ken French are members of the Board of Directors for and provide consulting services to Dimensional Fund Advisors LP.
CONCLUSION
In summary, there are differences in expected returns across stocks. Variables that tell us what an investor has to pay (market prices) and what they expect to receive (book equity and future profits) contain information about those expected returns. All else equal, the lower the price relative to book value and the higher the expected profitability, the higher the expected return.
What Dimensional has learned from its own work and the work of Professors Fama, French, Novy-Marx, and Wahal, as well as others, is that current profitability has information about expected profitability. This information can be used in tandem with variables like market capitalization or price-to-book ratios to extract the differences in expected returns embedded in market prices. As such, it allows investors to increase the expected return potential of their portfolio without trying to outguess market prices.

New Market Highs and Positive Expected Returns
JANUARY 2017
There has been much discussion in the news recently about new nominal highs in stock indices like the Dow Jones Industrial Average and the S&P 500.
When markets hit new highs, is that an indication that it’s time for investors to cash out? History tells us that a market index being at an all-time high generally does not provide actionable information for investors. For evidence, we can look at the S&P 500 Index for the better part of the last century. Exhibit 1 shows that from 1926 through the end of 2016, the proportion of annual returns that have been positive after a new monthly high is similar to the proportion of annual returns that have been positive after any index level. In fact, over this time period almost a third of the monthly observations were new closing highs for the index. Looking at this data, it is clear that new index highs have historically not been useful predictors of future returns.
Given that the level of an index by itself does not seemingly have a bearing on future returns, you may ask yourself a more fundamental question: What drives expected returns for stocks?
Exhibit 1. S&P Total Return Index Highs: 1926-2016
Percent of Months With Positive Return Over Next 12-Month Period
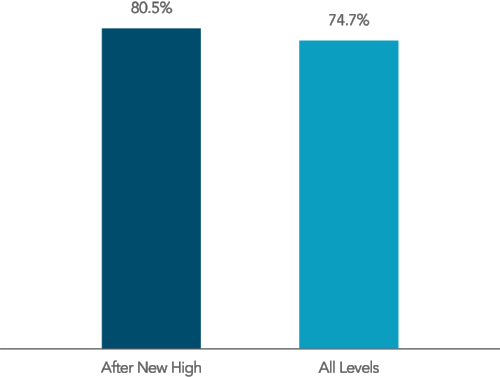
From January 1926–December 2016, 319 months, or approximately 29% of monthly observations, were new closing highs.
Note: 1,081 monthly observations. The S&P data is provided by Standard & Poor's Index Services Group. For illustrative purposes only. Index is not available for direct investment. Past performance is no guarantee of future results.
POSITIVE EXPECTED RETURNS
One way to compute the current value of an investment is to estimate the future cash flows the investment is expected to deliver and discount them back into today’s dollars. For an investment in a firm’s stock, this type of valuation method allows expectations about a firm’s future profits to be linked to its current stock price through a discount rate. The discount rate equals an investor’s expected return. A simple, but important, insight we glean from this is that the expected return from holding a stock is driven by the price paid for it and what its investors expect to receive.
Stock prices are the result of the interaction of many willing buyers and sellers. It is extremely unlikely that in aggregate, those willing buyers apply negative discount rates to the expected profits of the firms they are purchasing. Why? Because there is always a risk that expected profits will not materialize or that the price might decline because of unanticipated future events. If investors apply positive discount rates to the cash flows they expect to receive from owning a stock, we should expect the price of that stock to represent a level such that its expected return is always positive. Unless the expected cash flows are persistently biased downward or upward, we can expect this to be the case.
There is little evidence, though, that the aggregate expectations of investors that set market prices have been persistently biased downward or upward. Many studies document that professional money managers have been unable to deliver consistent outperformance by outguessing market prices. In the end, prices set by market forces are difficult to outguess. The market does a good job setting prices, and we can assume that the expected return investors have applied when setting prices are not biased.
Therefore, it is reasonable to assume that the price of a stock, or the price of a basket of stocks like the S&P 500 Index, should be set to a level such that its expected return is positive, regardless of whether or not that price level is at a new high. This helps explain why new index highs have not, on average, been followed by negative returns. At a new high, a new low, or something in between, expected returns are positive.
EXPECTED RETURNS, REALIZED RETURNS, AND HOLDING HORIZONS
Today’s prices depend on expected returns and expectations about future profits. If either expected returns or expectations about future profits change, prices will also change to reflect this new information. Changes in risk aversion, tastes and preferences, expectations about future profits, or the quantity of risk can all drive changes in expected returns. All else equal, an increase in expected returns is reflected through a drop in prices. A decrease in expected returns is reflected through a rise in prices. Thus, realized returns can differ from expected returns.
This means there is a probability that the realized return on any stock, an index like the S&P 500, or the market as a whole can be negative even when expected returns are positive. But what can we say about the relation between the probability of a negative realized return and an investor’s holding horizon?
Exhibit 2 shows rolling 10-year performance of the equity market premium (equity returns minus the return of one-month US Treasury bills, considered to be short-term, risk-free investments). In most periods it was positive, but in several periods it underperformed.
Exhibit 2. Historical Observations of 10-Year Premiums
Market minus one-month Treasury bills: US markets

Information provided by Dimensional Fund Advisors LP.
In US dollars. The 10-year rolling equity premium is computed as the 10-year annualized compound return on the Fama/French Total US Market Index minus the 10-year annualized compound return of the one-month US Treasury Bill. Fama/French indices provided by Ken French. Index descriptions available upon request. Eugene Fama and Ken French are members of the Board of Directors for and provide consulting services to Dimensional Fund Advisors LP. Indices are not available for direct investment. Their performance does not reflect the expenses associated with the management of an actual portfolio. Past performance is no guarantee of future results.
There is uncertainty around how long periods of underperformance like this may last. Historically, however, the probability of equity returns being positive increases over longer time periods compared to shorter periods. Exhibit 3 shows the percentage of time that the equity market premium was positive over different time periods going back to 1928. When the length of the time period measured increases, so does the chance of the equity market premium being positive. So to answer our question from before: as an investor’s holding period increases, the probability of a negative realized return decreases. This is why it is important to choose a level of equity exposure that you can stay invested in over the long term.
Exhibit 3. Historical Performance of Equity Market Premium over Rolling Periods
US markets overlapping periods: January 1928–December 2015

Market is Fama/French Total US Market Index. T-Bills is One-Month US Treasury Bills. There are 877 overlapping 15-year periods, 937 overlapping 10-year periods, 997 overlapping five-year periods, and 1,045 overlapping one-year periods.
Information provided by Dimensional Fund Advisors LP. Based on rolling annualized returns using monthly data. Rolling multiyear periods overlap and are not independent. This statistical dependence must be considered when assessing the reliability of long-horizon return differences. Fama/French indices provided by Ken French. Index descriptions available upon request. Eugene Fama and Ken French are members of the Board of Directors for and provide consulting services to Dimensional Fund Advisors LP. Indices are not available for direct investment. Past performance is not a guarantee of future results.
CONCLUSION
By themselves, new all-time highs in equity markets have historically not been useful predictors of future returns. While positive realized returns are never guaranteed, equity investments have positive expected returns regardless of index levels or prior short-term market returns. The collective wisdom of market participants and their competitive assessment of expected returns and risks allow investors to rely on the information contained in prices to inform their investment decisions and assume positive expected returns from stocks. Historically speaking, over longer time horizons, the odds of realized stock returns being positive have increased. This is one reason why investors should consider investing a long-term commitment: Staying invested and not making changes based on short-term predictions increases your likelihood of success.

Negative Real Returns
November 2016
Nominal interest rates are currently below zero in many countries, including Germany, Denmark, Switzerland, Sweden, and Japan.
These levels have turned the common belief that zero is the lower bound for such rates on its head. While negative nominal rates are a relatively new phenomenon, periods of widespread negative real returns across countries have been quite common.
WHY CARE ABOUT REAL RATES OF RETURN?
In 1970, a loaf of bread cost 25 cents. A gallon of gas cost 36 cents. Today, an average loaf of bread and a gallon of gas each cost around two dollars.[1] When the prices of goods and services increase, consumers can buy fewer of them with every dollar they saved. This is called inflation, and it eats into investors' returns.
Real rates of return are adjusted for inflation, so they account for changes in the purchasing power of a dollar over the life of an investment. Because inflation affects the cost of living, investors must consider the inflation-adjusted—or real—return of their investments. When inflation outpaces the nominal returns on an investment, investors experience negative real returns and actually lose purchasing power.
BRIEF HISTORY: TREASURY BILL RETURNS
Exhibit 1 shows the annual real returns on one-month US Treasury bills. From 2009 to 2015, the annual real return was negative. This circumstance is not unprecedented. Since 1900, the US has had negative real returns in over a third of those years. And negative real returns on government bills are not exclusive to the US. All countries listed in Exhibit 2 have had negative real returns on their respective government bills in at least one out of every five years from 1900 to 2015.
Exhibit 1. Annual Real Returns of One-Month US Treasury Bills

Source: Dimson, Marsh, and Staunton (DMS); Morningstar.
Exhibit 2. Percent of Years with Negative Real Returns on Government Bills, 1900-2015

Source: Dimson, Marsh, and Staunton (DMS); Morningstar.
BOND INVESTORS MAY GET MORE THAN THE BILL RETURN
In the current low-yield environment, rolling over short-term bills may not seem appealing to investors keen on protecting their purchasing power. Exhibit 3 shows that the return of one-month US Treasury bills has not kept pace with inflation [2] over the past 10 years. But even when the real return on bills is negative, a relatively common occurrence, bond investors may still achieve positive expected real returns by broadening their investment universe. The bond market is composed of thousands of global bonds with different characteristics. Many of those bonds allow investors to target global term and credit premiums, which in turn may provide positive real returns even in low interest rate environments. Exhibit 3 also shows that the Barclays Global Aggregate Bond Index has outpaced inflation while maintaining low real return volatility of 3.4% annualized over the past 10 years.
Exhibit 3. Trailing Annualized Returns

Global diversification is often thought of as a tool for reducing risk. However, when it comes to fixed income, global portfolios can also play an important role in the pursuit of increased expected returns. Even if the expected real returns of bonds in one country are negative, another yield curve may provide positive expected real returns. The flexibility to pursue higher expected returns by investing in bonds around the world can be an important defense against low, and even negative, yields.
CONCLUSION
The goal of many investors is to grow some (or all) of their savings in real terms. Even in a low interest rate environment, there may be bond investments that can still achieve this goal. In particular, investors who target global term and credit premiums should be better positioned to pursue higher expected returns.
About the Author
Mark Bourguignon is the Founder and President of Ascend Wealth Management. Previously, Mark was a Director at Clearbridge Investments, a Legg Mason Company, where he was a Fund Manager for the Clearbridge Small Cap Value Fund and a Senior Portfolio Analyst for the firms all cap value, balanced income, and small cap strategies. Prior to Clearbridge, Mark served as the Director of Research for Option Advantage Partners L.P., which was the first private equity fund to provide institutional funding to entrepreneurs who wanted to tax-efficiently exercise their stock options. Mark led the fund's research effort on behalf of the General Partner and its accredited investors. Mark began his career as an equity research analyst at the investment banking firms Donaldson, Lufkin and Jenrette and Thomas Weisel Partners. Mark earned a Bachelor of Science degree in Finance from Marquette University.
About Ascend Wealth Management
Ascend Wealth Management is an independent private wealth management firm that works with individuals and families. The firm provides the highest standard of care and ethics in the investment industry—a fiduciary standard—which means their advice always serves a single purpose: to build financial security and wealth for you and your family.
The firm works closely with its clients in order to understand their unique needs, goals and risk tolerance and then builds customized investment portfolios of institutional-class funds designed specifically for long-term investors who are seeking an alternative to what is commonly available among the investment industry. Their strategy is based on sound, time-tested principles that have been confirmed by Nobel Prize-winning research and decades of empirical evidence.
We welcome the opportunity to meet with you, conduct a thorough review of your current investment strategy, answer all of your questions, and discuss how a sensible, evidence-based investment approach can provide you with greater prosperity and peace of mind that comes from knowing that your money is being managed with expert care.
[1] Source: Bureau of Labor Statistics; [2] Measured as changes in the Consumer Price Index (CPI), which is defined by the US Department of Labor, Bureau of Labor and Statistics.
For more information, please email Mark Bourguignon at mark@ascendwealth.com.
Ascend Wealth Management Inc. is a Registered Investment Adviser. We serve as an independent, fee-only wealth management firm for individuals, families and institutions to help them achieve their investment goals. To learn more about us and our services, please visit our website or contact us at info@ascendwealth.com.
This newsletter is solely for informational purposes. Advisory services are only offered to clients or prospective clients where Ascend Wealth Management Inc. and its representatives are properly licensed or exempt from licensure. Past performance is no guarantee of future returns. Investing involves risk and possible loss of principal capital. No advice may be rendered by Ascend Wealth Management Inc. unless a client service agreement is in place.